

DIA at a glance
Start of main content
Distribuidora Internacional de Alimentación S.A., DIA, is a multi-banner, multi-channel, and multi-brand distribution company that sells food, household, health and beauty products to more than 40 million clients worldwide. With stores in Spain, Portugal, Argentina, and Brazil (102-6), the company, which is listed on the Madrid Stock Exchange and in the selective Ibex 35, generates an average annual turnover of more than EUR10bn.
Main figures (102-7)
Turnover of 10.34bn
7,388 stores 3,603 own stores
3,785 franchises
+ 7,000own-label SKUsconsumer products
+ 42,600 employees
+ 24,000 jobs created in franchises
40 million clients worldwide
40 million clients in thecompany’s loyalty programme
+ 1bn€ retributionsdistributed to shareholders since 2011
17.83(millions of euros)Investment in environmental improvements in 2017
7,786.88CO2 emissions savings in 2017
electrical consumtion: 310.10 Kwh/m2
Business map
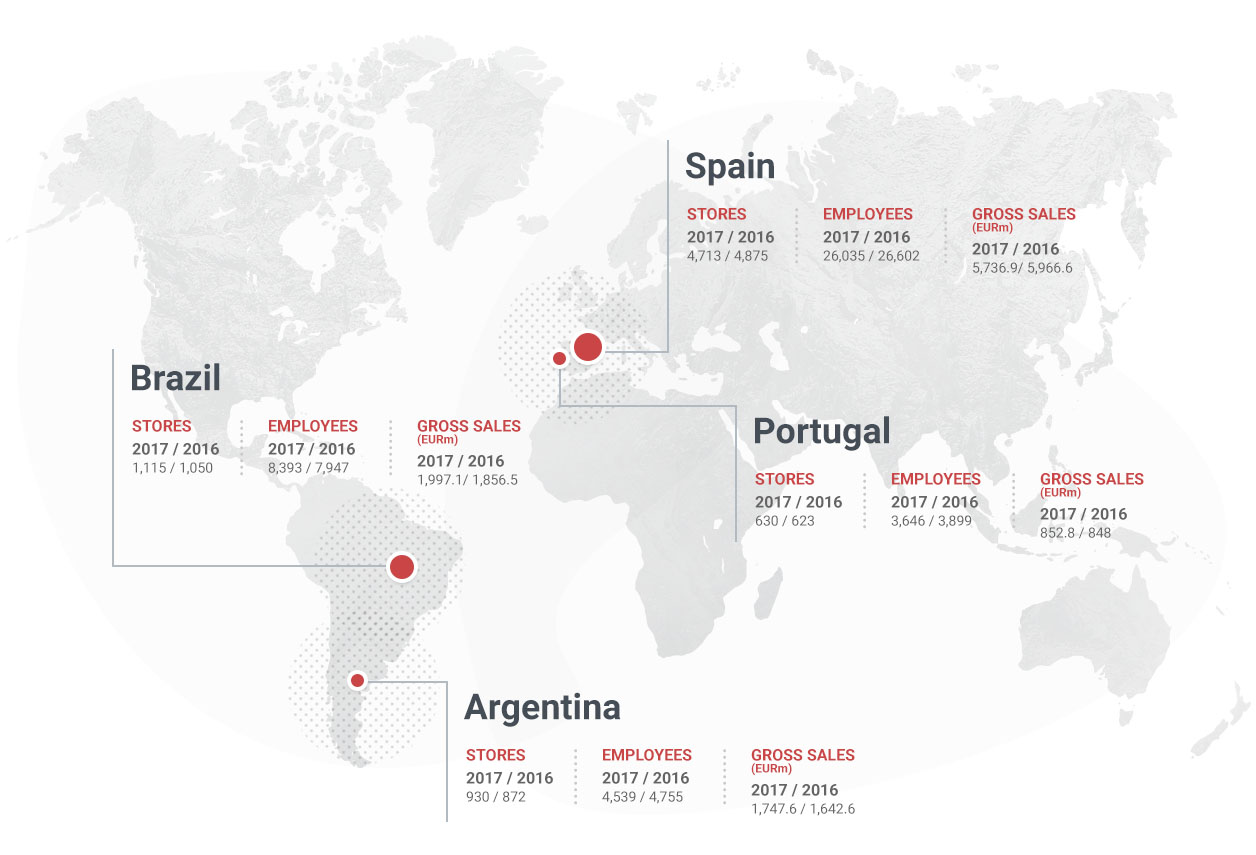
| Stores | Employees | Gross sales (EURm) |
||||
|---|---|---|---|---|---|---|
| 2016 | 2017 | 2016 | 2017 | 2016 | 2017 | |
| Spain | 4,875 | 4,713 | 26,602 | 26,035 | 5,966.6 | 5,736.9 |
| Portugal | 623 | 630 | 3,899 | 3,646 | 848 | 852.8 |
| Argentina | 872 | 930 | 4,755 | 4,539 | 1,642.6 | 1,747.6 |
| Brazil | 1,050 | 1,115 | 7,947 | 8,393 | 1,856.5 | 1,977.1 |
Banners & brands
Banners
Proximity format
Surface area of between 400 and 700 m2.
Expanding the offer in perishable goods.
Specialists in household, health, and beauty
Close to 6,000 SKUs.
Surface area of between 160 and 260 square metres in urban areas.
Family proximity supermarket
Broad perishables offer and personalised customer service More than 7,500 SKUs, of which 1,500 are fresh.
300, 500, 700, or 1,000 m2 in urban areas
Stores in small towns, especially rural ones that do not require investment in store infrastructure
Managed by franchisees.
Attraction format
Surface area of between 700 and 1,000 m2 in suburban areas
Customer parking
More than 3,500 SKUs

Specalised in serving professionals and the self-employed in hotels, catering, and groups
Assortment of over 4,000 SKUs.

Covers two types of stores in the Portuguese market:
Minipreço Market: proximity in urban centres: Surface area of 250-400 m2 and assortment of 3,000 SKUs.
Minipreço Family: attraction in the suburbs: Surface area of up to 1,000 m2 with covered parking and up to 4,500 SKUs.
Rural stores in the Portuguese market that do not require investment in store infrastructure.
They are run by franchisees
Brands

DIA
This is the group’s historical brand. With a track record of over 30 years and more than 5,600 SKUs, it encompasses all of the consumer product categories.
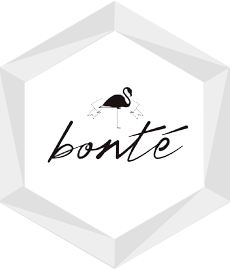
Bonté
This brand is specialised in hygiene and personal care products. It currently includes more than 660 SKUs, and has seen strong growth in recent years.
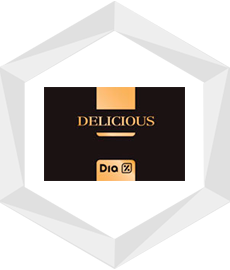
Delicious
This is the Group’s Premium brand, with the highest level of added value. It includes 250 SKUS.
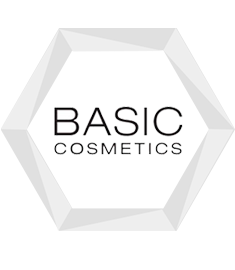
Basic Cosmetics
This own-label brand is focused on makeup and decorative cosmetics. It currently includes 550 SKUS.

BabySmile y JuniorSmile
This brand specialises in baby care and junior care. At the end of 2017, it had more than 230 SKUs.

As
This own-label brand is focused on pet care and includes over 160 SKUs.
Vital
This is the latest own-label brand developed by the DIA Group, and specialises in products related to a healthy, balanced diet..
Main Financial Indicators
| 2016 | 2017 | |
|---|---|---|
| Gross sales under banner | 10,550 | 10,334.4 |
| Net sales | 8,867.6 | 8,620.6 |
| Adjusted EBITDA | 625.1 | 568.6 |
| Investment | 345.4 | 302.6 |
| Net debt | 878.3 | 891.3 |
| Underlying net profit | 258.6 | 217.0 |
1(102-45) (The financial statements correspond to consolidated financial statements of all group entities).
| 31/12/2016(*) | 31/12/2017 | |
|---|---|---|
| Economic value generated | 8,807,204 | 8,781,328 |
| Net business turnover | 8,669,257 | 8,620,550 |
| Other income (**) | 126,198 | 155,660 |
| Financial income | 11,656 | 4,830 |
| Income from companies using the equity method | 93 | 288 |
| Economic value distributed | 8,505,284 | 8,511,742 |
| Goods and other consumables | 6,767,370 | 6,808,596 |
| Personnel expenses | 833,643 | 808,943 |
| Operating expense | 633,513 | 645,071 |
| Losses on disposal of fixed assets (**) | 10,811 | 17,728 |
| Financial expenses | 62,293 | 65,868 |
| Tax on profits | 69,119 | 55,350 |
| Dividends (***) | 128,535 | 110,186 |
| Economic value retained | 301,920 | 269,586 |
(*) With the China activities re-expressed as interrupted.
(**) Re-expressed by the profits obtained from the sale of buildings to third parties.
(***) As of 31 December 2017, the dividends correspond to the proposed distribution of the fiscal 2017 results which will be presented for approval, while the dividends as of 31 December 2016 correspond to those paid in fiscal 2017 against the results from the previous fiscal year.
End of main content