Trade Working Capital
Start of main content
Trade Working Capital, Capex and debt
Trade Working Capital

DIA’s negative value of trade working capital declined by 7.3% to EUR919m, down by 2.1% ex-currency.
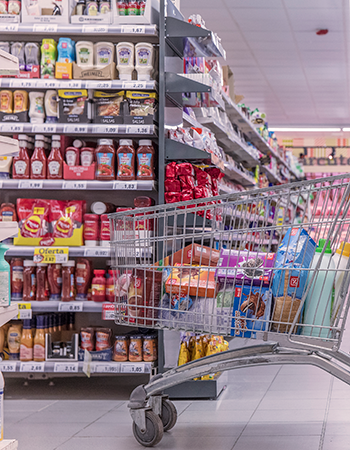
The value of inventories declined by 13.4% in 2017, EUR88.4m down to EUR569.6m (a 6.1% decrease ex-currency). This material reduction of stock was partly attributable to the Double E-Project in Spain, but also to the implementation of similar initiatives in the rest of the DIA countries and due to the depreciation of currencies.
Trade and other receivables increased by 34.5% in 2017, up by 43.8% ex-currency. This EUR56.9m growth in the value of debtors to EUR221.8m is explained both by the increase in trade receivables from suppliers (EUR35.4m) and the expansion of the franchised activity (EUR21.5m).
The value of trade and other payables decreased by 5.7% to EUR1.71bn, up by 0.6% at constant currency. This decline is due to the limited sales growth, the challenging comparison base in 2016, and the depreciation of LatAm currencies at the end of 2017.
Non-recourse factoring from receivables from our suppliers amounted to EUR99.6m by the end of December 2017, compared with EUR88.4m at the end of December 2016.
The equivalent number of days of negative trade working capital (over COGS) decreased by 4.2 days from 53.5 in 2016 (adjusted by the discontinuation of DIA China) to 49.3 days in 2017.
| 31 Dec 2016(2) | 31 Dec 2017 | Change | Change (ex-FX) | |
|---|---|---|---|---|
| Inventories (A) | 658.0 | 569.6 | -13.4% | -6.1% |
| Trade & other receivables (B) | 164.9 | 221.8 | 34.5% | 43.8% |
| Trade receivables with franchisees | 101.2 | 122.7 | 21.2% | |
| Trade receivables with suppliers & other | 63.7 | 99.1 | 55.6% | |
| Trade & other payables (C) | 1,815.1 | 1,710.8 | -5.7% | 0.6% |
| Trade Working Capital (1) | -992.2 | -919.3 | -7.3% | -2.1% |
(1) Trade working capital defined as (A+B-C),
(2) Figures adjusted by the discontinuation of DIA China
Capex
DIA invested EUR302.6m in 2017, 12.4% less than in the same period last year. This value of investment was completely in line with the initial capex guidance provided in February 2017 (“Capex to continue declining in 2017”) and in October 2017 (“around EUR300m”).

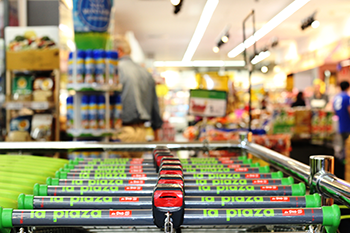
In Iberia, capital expenditure decreased by 26.9% to EUR165m, as remodelling efforts in the most expensive transformations in La Plaza and Dia Maxi stores in Spain were significantly lower, and investment in openings more than halved during the year. In Portugal, 2017 capex was slightly lower than in 2016.
In Emerging Markets, investment increased by 15.0% in Euros (17.4% in local currency) to EUR137.6m, which represents 45.5% of the total company expenditure in 2017. Investment in fixed assets rose significantly in 2017 in both countries. The increase in capex in Argentina was related to store upgrade programmes, while in Brazil was almost entirely due to new openings and IT.
In 2018, the company plans to invest EUR320-350m, with a very balanced split between openings and remodelling projects. For the third consecutive year, IT capex is set to grow significantly in 2018.
| 2016 | % | 2017 | % | Cambio | Cambio (ex-FX) | |
|---|---|---|---|---|---|---|
| Iberia | 225.8 | 65.4% | 165.0 | 54.5% | -26.9% | -26.9% |
| Emerging markets | 119.6 | 34.6% | 137.6 | 45.5% | 15.0% | 17.4% |
| TOTAL Capex | 345.4 | 100% | 302.6 | 100.0% | -12.4% | -11.5% |
Net Debt
 Net debt at the end of December 2017 amounted to EUR891.3m, EUR13m higher than in the same period last year.
During 2017, the average number of treasury shares the company kept in its balance sheet barely changed (10.6m shares in 2017 vs. 9.3m shares in 2016). Regarding dividends, in July 2017 DIA paid EUR128.5m to shareholders, which was EUR6.3m more than in 2016.
As of December 2017, the ratio of net debt over the last twelve months’ adjusted EBITDA was 1.6x, while DIA’s estimates for the adjusted leverage ratio calculated under the S&P and Moody’s methodology are 2.2x and 3.6x respectively. All these ratios imply significant scope for potential additional leverage without threatening the company’s corporate investment grade rating.
In 2017, DIA obtained proceeds of EUR68.2m from asset disposals, related to a group of stores divested in the last quarter of the year.
| 31 Dec 2015 | 31 Dec 2016 | 31 Dec 2017 | |
|---|---|---|---|
| Net debt / Adj. EBITDA | 1.8x | 1.4x | 1.6x |
| Adjusted net debt / Adj. EBITDA (S&P | 2.5x | 2.0x | 2.2x(1) |
| Adjusted net debt / Adj. EBITDA (Moody’s) | 3.5x | 3.4x | 3.6x(1) |
| Net debt | 1,132.4 | 878.3 | 891.3 |
(1) Company estimate.
- Sales Performance
- Sales
- Operating Results
- Profits
- Review by segment
- Trade Working Capital,capex and debt
- Definition of APMs
End of main content


